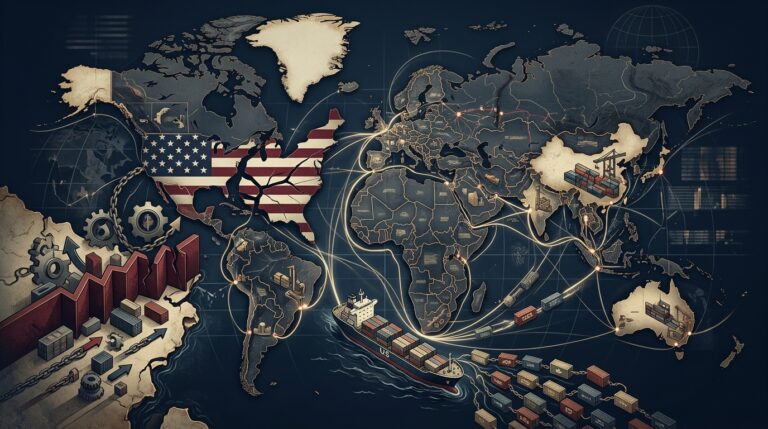
The predicted collapse in U.S. trade volumes and surge in consumer prices following the Supreme Court’s February 2026 tariff ruling never materialized. Instead of a direct inflationary shock, the economic impact of the U.S. tariff strategy was absorbed and rerouted by a surprisingly adaptive global supply chain. This transformed a potential consumer crisis into a slower, more concentrated drag on specific domestic sectors.
Understanding the 2026 US Tariff Realignment
In early 2026, the Supreme Court invalidated a broad set of tariffs enacted under the International Emergency Economic Powers Act (IEEPA) source. In response, the executive branch quickly pivoted, using alternative statutes like Section 232 and Section 301 to maintain its trade policy posture source.
Before this legal shift, the average effective U.S. tariff rate stood at 11.8% source. These duties generated significant government income, with cumulative customs revenue reaching $239.5 billion through March 2026 source. The continuity of high tariffs, despite the change in legal authority, led most economic models to forecast significant disruption.
How Global Trade Absorbed the US Tariff Impact
Analysis of trade data reveals two primary mechanisms that buffered the U.S. economy from the expected shock. First, foreign exporters, particularly in China, absorbed a substantial portion of the tariff costs by reducing their own profit margins rather than passing the full cost to U.S. importers source. This strategy was aimed at preserving market share in the competitive U.S. market.
Second, supply chains actively rerouted. Instead of shipping finished goods directly, Chinese manufacturers increased exports of components to intermediary hubs in ASEAN and Latin American countries. These components were then assembled and re-exported to the U.S. under different tariff classifications, effectively circumventing the highest duties source779864_EN.pdf). This structural adaptation maintained import volumes while fundamentally altering trade routes and value chains source.
The Real Cost of the US Tariff Strategy
The consequence of this adaptation is that the primary economic drag shifted from consumer inflation to long-term capital reallocation and sectoral pressure within the U.S. source. With import costs for key inputs remaining elevated, industries reliant on those goods face sustained pressure.
Modeling from The Budget Lab at Yale projects a long-run contraction of 2.5% in the U.S. construction sector, a direct result of tariffs on building materials and components source. This illustrates how the policy’s economic cost is being borne by specific industries through reduced investment and output, rather than by consumers at the retail counter source.
What Remains Uncertain
The long-term durability of these supply chain workarounds is not guaranteed. It remains unclear how long foreign exporters can sustain compressed margins. Furthermore, the full impact of capital being diverted from sectors like construction to less tariff-affected industries will take several more quarters to measure accurately in terms of employment and productivity.
Next Watchpoint
For market participants tracking the real impact of the U.S. tariff policy, the key documents to watch are the U.S. International Trade Commission’s (ITC) quarterly report on import origins, expected in late October 2026, and the Department of Commerce’s final Q3 2026 data on sector-specific capital expenditures. These releases will provide the first hard data on whether the supply chain rerouting and sectoral investment drag observed in the first half of the year are accelerating.
—
Disclaimer: This article is for informational purposes only and does not constitute financial, legal, or tax advice. This article was researched and drafted with AI assistance, then reviewed by our editorial team before publication. Market conditions are subject to change. Readers should consult with a licensed professional before making any investment decisions.
Want the full institutional-style PDF version? Enter your email for the free PDF.
Related Analysis
- U.S. Tariff Rate Drops to 7.2% as Section 122 Expires
- U.S.-Brazil Trade Standoff: Section 301 Tariffs and the Economic Reciprocity Law
- Supply Chain Realignment and the Intermediation Dilemma in Global Trade
- Suez Reopening: Why Freight Rates Won’t Collapse
- Mineral Export Curbs Hurt Supply Chain Investment